Money flow index indicator
The Money flow index indicator connects a concept of the price with the volume of money which forms it.
Contents
- Mathematics and parameters
- The use in trade
- Strategy with use of the indicator
- Several practical remarks
The Money flow index indicator connects a concept of the price with the volume of money which forms it. It is developed as a part of the Trade Chaos theory of Bill Williams, compares positive and negative cash flows on an asset for the chosen period.
Mathematics and parameters
Money Flow Index uses the concept Typical price − an arithmetic average of maximum, minimum and the prices of the closing of the current candle: TypicalPrice = (High+Low+Close)/3.
We remind: only tick volumes are used on Forex, but it is meant that their dynamics are similar to exchange. According to the author, it allows seeing what speed money «enters and leaves the market».
Money Flow is the basic concept when calculating which is defined by the product of the typical price and the trading volume for the period: Money Flow(i) = Tp(i)*Volume(i).
If the current typical price is more than previous – the stream is positive (Positive Money Flow) if the typical price falls − by negative (Negative Money Flow).
Further we define the monetary relation for the period: Money Ratio = ∑ (Positive Money Flow(i)) / ∑ (Negative Money Flow(i)).
Final stage − calculation of values of the indicator: Money Flow Index = 100 – (100 / (1+Money Ratio).
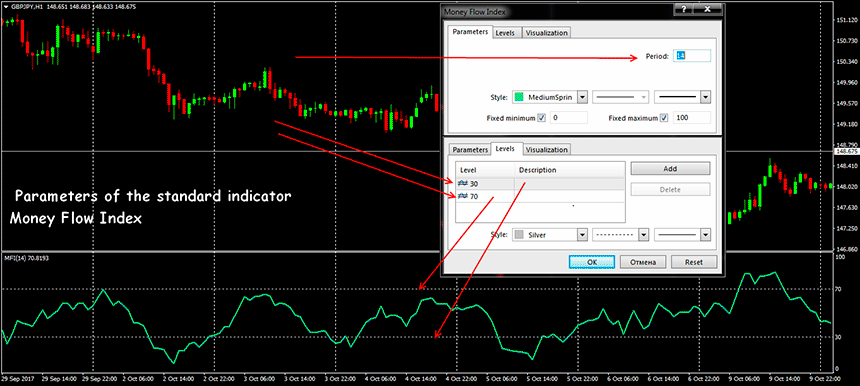
The indicator is the oscillator line in an additional window, with traditional levels of overbought / oversold zones (70/30 or 80/20). Usually, values are calculated for 14 bars (it is recommended by Williams); the calculation period is less, the line is more volatile.
The use in trade
From the point of view of the market, «stream» of money shows demand for an asset at the certain price.
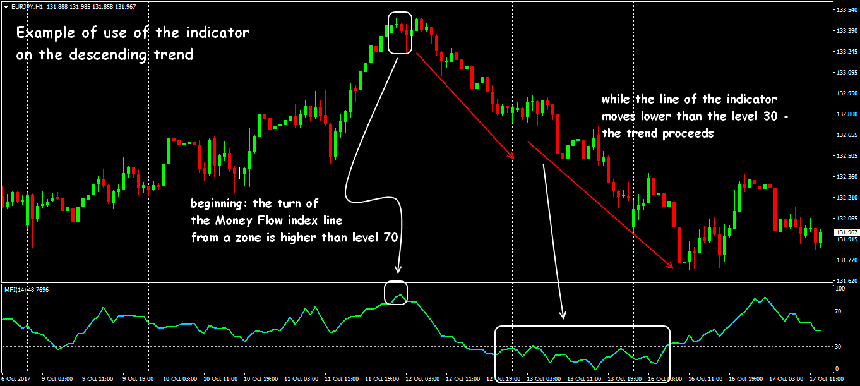
If the Typical price for the current period is higher than for previous, then investors actively invest money in this asset – it is worth waiting for growth; if the Typical price falls − investors lose interest in an asset – we expect to fall.
If the price chart shows growth, and the Money Flow Index value falls (or on the contrary) – we wait for an active turn.
Trade signals of the indicator divide into three groups:
Overbought / oversold of the market condition
Purchase: the line of the indicator crosses level 20 from below up; sale: the line of the indicator crosses the line 80 from top to down. The turn has to occur above/below the corresponding borders, the contact of levels is a weak signal.
Divergence with the price
The signal has the advancing character, but only the strongest types of divergence are steadily fulfilled: a straight line – for sale, return (convergence) – on the purchase. The transaction opens at an exit of the line of the indicator from critical zones with StopLoss behind a local extremum.
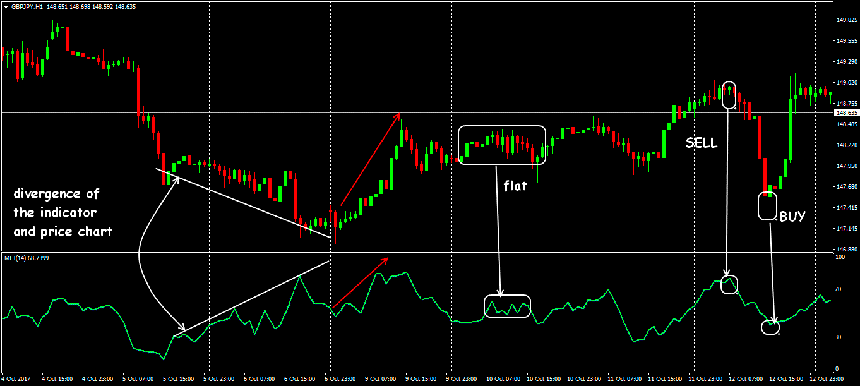
The situation can keep in the market long enough, but without turn, therefore, the entrance to the market requires additional confirmation
Graphic figures on the line of the indicator
The emergence of standard patterns on the line of the indicator advances for several periods a formation of similar figures on the price chart. Transactions are made in the case of breakthrough by lines of the indicator of the line of a trend after turning figures, StopLoss − behind a local extremum.
Strategy with use of the indicator
Bollinger Band + MFI
In such system, the Money flow index indicators can be used for an entrance or on change of the direction of the average line, or at the time of crossing of borders of the channel.
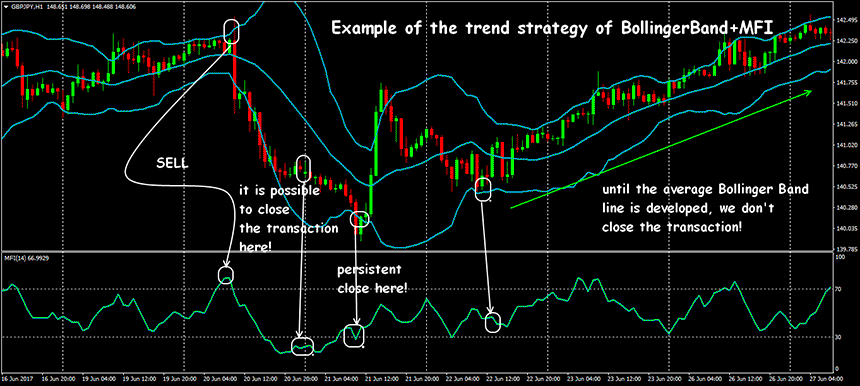
StopLoss can be placed behind local max/min, and to close transactions – on standard signals of Bollinger Bands.
Scalping within MFI
Asset: EUR/USD, GBP/USD, AUD/USD. Time frame – M15, M30. Indicators: MFI(6) levels 30/70, SMA(3) on data of MFI.
Purchase: the MFI line crosses SMA from below up lower than the level 30.
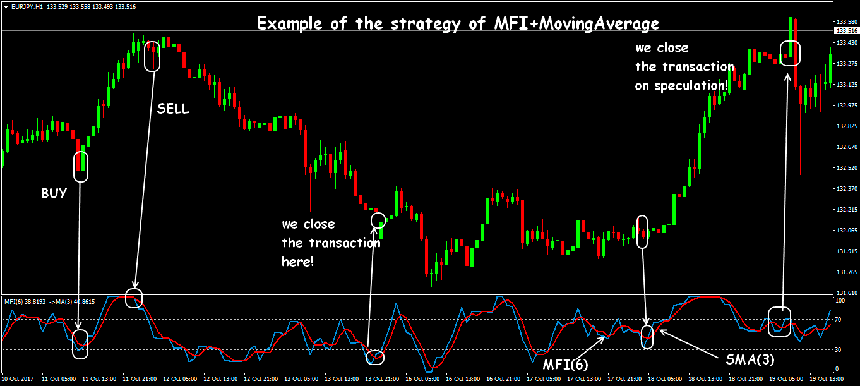
Sale: the MFI line crosses SMA from top to down higher than the level 70.
Entrance to the market at the opening of the following candle. StopLoss – on the next max/min, but not less than 10 points. The active trailing with a step of 5-10 points is recommended for TakeProfit.
The combined MFI
Asset: currency pairs with stable volatility. Time frame: M15-H1. Indicators: SMA(300) and the «synthetic» tool of three algorithms – MFI(100), Standard Deviation (10) and RSI (10). Levels for MFI – standard.
Extreme values of the combined indicator appear strictly after contact of critical levels.
Purchase: SMA(300) is directed up (a medium-term trend – ascending); «synthetic» RSI was developed down higher than the level 70.
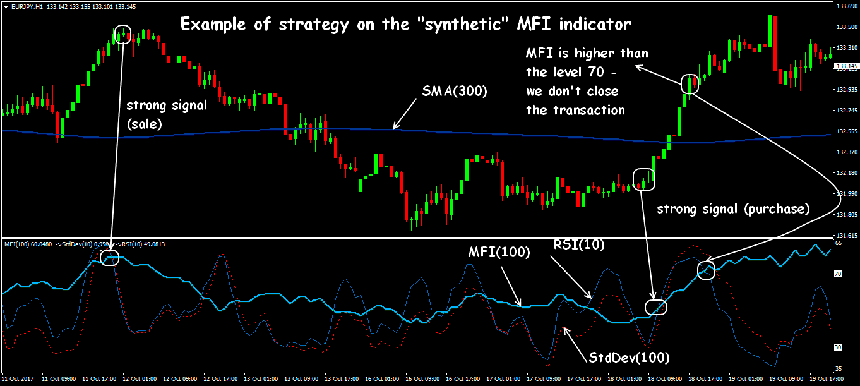
Sale: SMA(300) is directed down (the descending trend); «synthetic» RSI was developed up lower than the level 30.
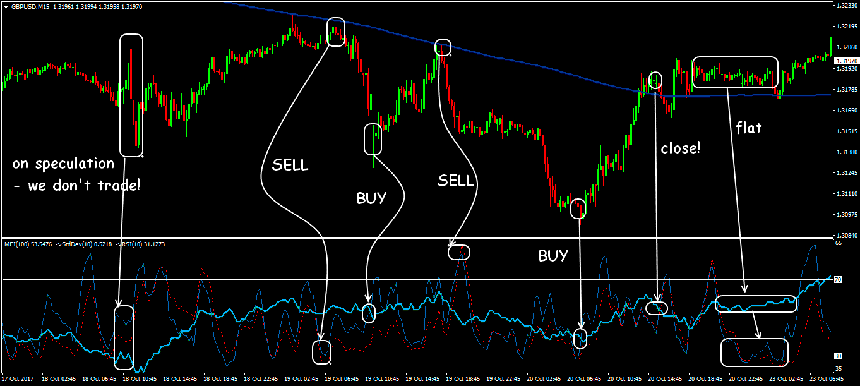
StopLoss − at the level of the next max/min, but not less than 20 points, for TakeProfit – a trailing with a step of 10-15 points.
Several practical notes
The MFI indicator gives the chance to see visually the current distribution of forces between sellers and buyers and also changes of this situation in the near future.
The averaging mechanism is not included into calculation of Money Flow Index, that is indicator values change synchronously with the price, and in case of sharp changes in data – are ahead of it.
Money Flow Index − typical oscillator, therefore, its signals at the beginning of the strong trend can «hang up» for a long time in critical zones. For stable strategy, the trend filter is surely necessary.
The Money flow indicator is a steadier tool than, for example, RSI, but it is worth to remember that it was initially developed for the stock market where there is much more information for prediction. The indicator consistently works at any assets and the periods, but its signals require additional confirmation.


