Contents
- Mathematics and parameters
- Application in trade
- Strategy on the basis of Momentum
- Strategy Elder's Moment
- Several practical remarks
The Momentum indicator is the exchange trend tool for assessment of force of the market and the analysis of price dynamics on time. Successfully copes with an oscillator role, gives the advancing signals of «slowdown» and a possible turn of the price movement.
Mathematics and parameters
The practical idea is applied that before each turn the market has to «slow down», therefore, at first the line of the indicator changes the direction and only after that the real turn on the price chart occurs.
From the point of view of mathematics, calculation of Momentum is the result of the ratio of the market price (current) to the last price displaced on some number of bars back. Several formulas of calculation are offered. The first, and, according to modern traders, the most correct, has been published in the book by J. Murphy «Technical analysis of the futures markets». It looks approximately so:
Momentum (t,n) = P(t) – P(t-n)
where
Momentum (t, n) – value a momentum for N periods prior to the current value t;
P(t) – the current price;
P(t-n) – the price prior to N periods to the current value t.
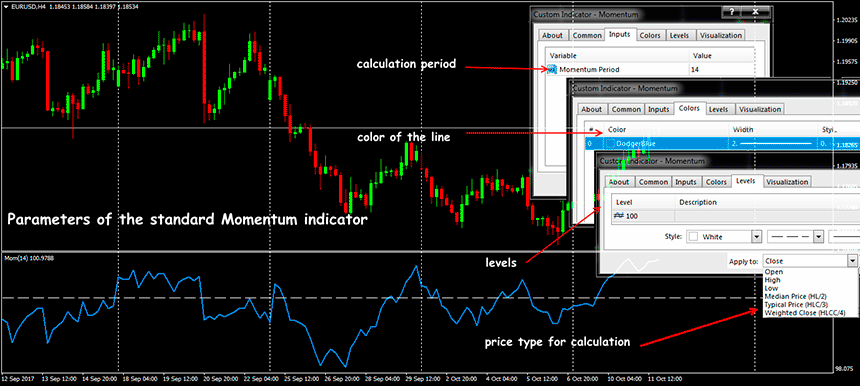
Visually Momentum Forex indicator is a curve with the price scale in an additional window, which fluctuations give the chance to forecast a point of change of a trend. Only the number of bars for calculation is specified in standard parameters – 14 is considered as optimum and also the color scheme for lines. On small time frames and for more aggressive trade the value of the parameter can be reduced, then signals will be more, but they turn out riskier. For day schedules parameter 25 is recommended.
Application in trade
The Momentum Indicator is positive if it`s line moves above the zero line − the current price above previous – the market trend ascending.
If the line is below zero level − the Momentum is negative − the current price is below than previous – the trend descending. Change of the sign is treated as a signal for the opening of a position in the direction of change of the sign of the indicator. The growth of values of the Momentum indicator trading says that this direction becomes stronger («accelerates»).
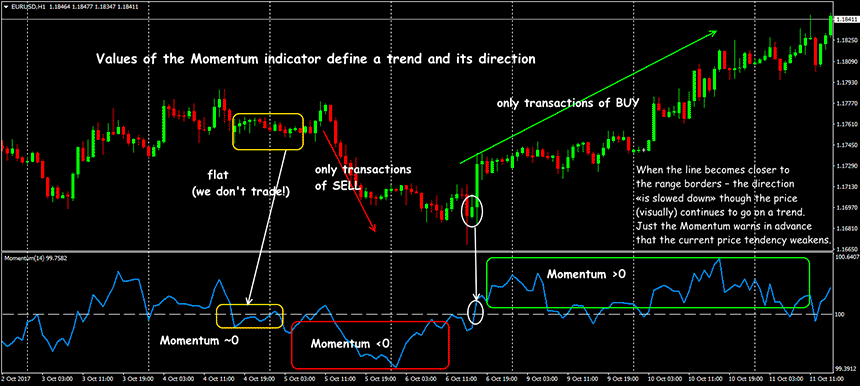
If the line becomes right – the market «calms down» – acceleration of market price is almost equal to the acceleration of the price of closing displaced on several candles back. The momentum is considered zero if the prices move in the narrow range at one level. The longer flat, the more closely the Momentum line will «nestle» on the basic line.
The break of the trend line on Momentum graphics most often advances similar break of a trend on the price schedule. After a point of the breakthrough of borders, the direction of acceleration of the market will change on the return. Sharp «splash» of the movements means either speculative reaction to the non-standard market or the beginning of a new trend.
Strategy on the basis of Momentum
Momentum trading indicators are used in trade in three tactics: trade on the main trend, fulfillment of situations of divergence/convergence.
Trade on the main trend. The signal arises in points of the breakthrough of the central line: from below up – the schedule above zero − we open to purchase, from top to down – the line is below zero − sale. The signal arises before a real price turn. The signal on the continuation of the available trend – if the line moves to areas of the highest (or the lowest) values. Control of the moments of the breakthrough of borders and average line. The Momentum indicators turning from levels (+/-) 100 will be a signal of the opening of the transaction: from below up − for purchase (BUY), from top to down − for sale (SELL). What exactly value of the turn will mean sure change of a trend, is defined by features of a trade asset and a time frame. The necessary levels are added in settings.
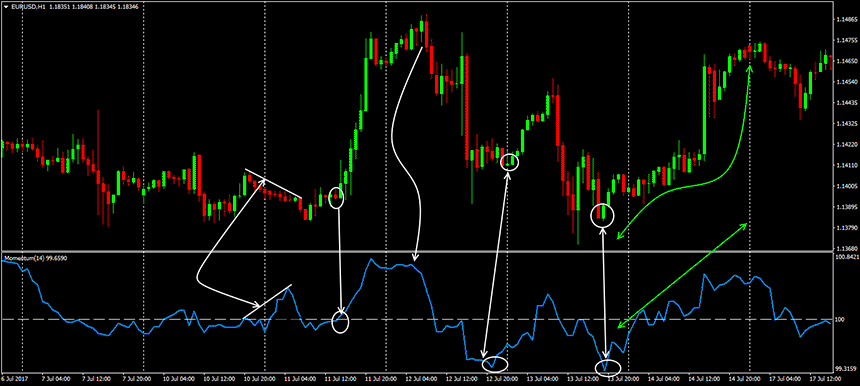
Divergence/convergence. The most part of time the price chart has the direction, identical with the Momentum, divergences in the movement speak about the beginning of a change of balance of forces between sellers and buyers. It is worth expecting a close turn of a trend which has to be confirmed with other tools.
At any tactics of the trade, it is forbidden to enter against the direction of the indicator or before the line shows an inclination in the direction, necessary for the trade.
Strategy Elder's Moment
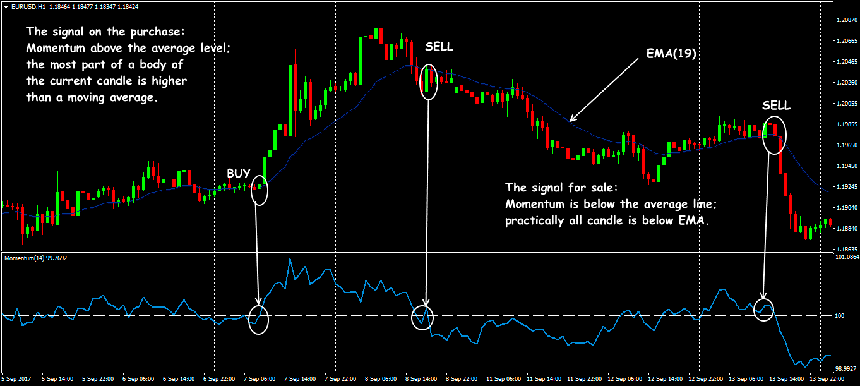
Reliability of signals significantly increases at the combination with moving averages: the technique which uses Momentum (14) and EMA (19) for H1-D1 time frames is considered a successful example.
Several practical remarks
The main effect of the Momentum Forex indicator is the use of the advancing signal of change of the market direction, future long-term trends and to estimate the force of the possible movement.
To exact assessment of a trend the «long» Momentum with a set of averages is applied, for more exact calculation of an entry point, the short Momentum is combined with RSI (and the same with the small period).
Best of all the tool works at medium-term and long-term transactions, but there are examples of successful use of the time frames of less than H1. For the convenience of the analysis it is possible to use multi-time frame option:
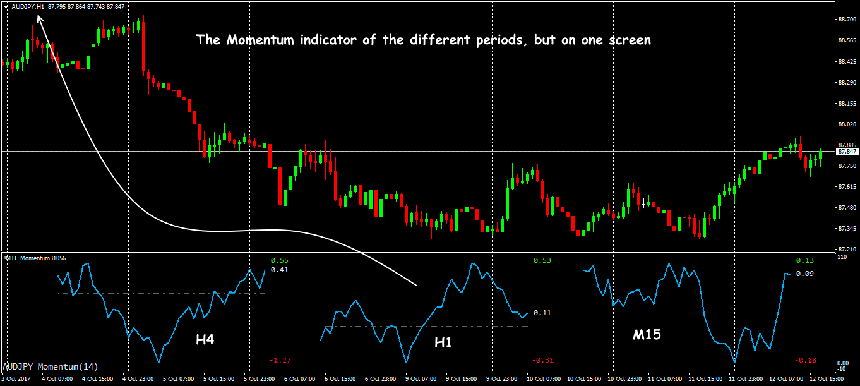
The trading Momentum indicator has a lack, typical for all oscillators − sharp fluctuations at the fast changes in price, for example, in the period of news. Especially many false signals are generated on the small periods, therefore, it is possible to use it only as a part of complex trade system.


