Contents
- Key specificities of weekly trading
- Weekly trend strategy
- Three oscillators of weekly strategy
- Lazy trader strategy
- Trend method
- Conclusion
While many forex market actors may prefer intraday trading due to the steadily growing market volatility, and thus opportunity to achieve greater yields within narrower timeframes, weekly forex trading strategies may allow for a more flexible merger of the investor's strategy and the trader's market tactics, thereby ensuring the opportunity to achieve stable profitability. In this article, we are going to investigate the key specificities of weekly strategies in the forex market and analyze briefly the main types of such strategies.
Key specificities of weekly Forex trading strategies
When choosing a forex weekly strategy, it should be borne in mind that the weekly candlestick provides extensive market information. In fact, it contains five daily candlesticks whereas the dynamic patterns of their change reflect the actual forex market trends. Within each particular trading week, such dynamics might change. By monitoting those actual tendencies and forecasting them, the trader may choose the best weekly forex strategy.
Generally, a weekly strategy in the forex market is based on a number of tools for avoiding excessive risks. Namely, it assumes a lower position size, and the main focus in the investigation of trends is put on the moving averages and extreme points of the weekly charts. Also, it should be understood that weekly traders bear opportunity costs, as they deposit funds which could otherwise be used for more profitable shorter-term transactions. However, potential steady profits within weekly strategies are the main aim of such trade.
Weekly trend strategy
This weekly forex strategy is based on the analysis of the exponential moving average (EMA). In order to effectively use this weekly chart forex strategy, it is required that the last week's last daily candlestick is closed at a level above the EMA value. Next, the trader expects the moment when the last week's maximum is broken, and places a buy stop order on H4 closed candlestick at the price of the broken level. Stop loss is after the nearest minimum point, between 50 and 105 pips. If the nearest minimum point is closer then 50 pips, the previous extreme value is taken for calculations. The last week's movement range is the take profit range. The break-even point is achieved after half the movement.
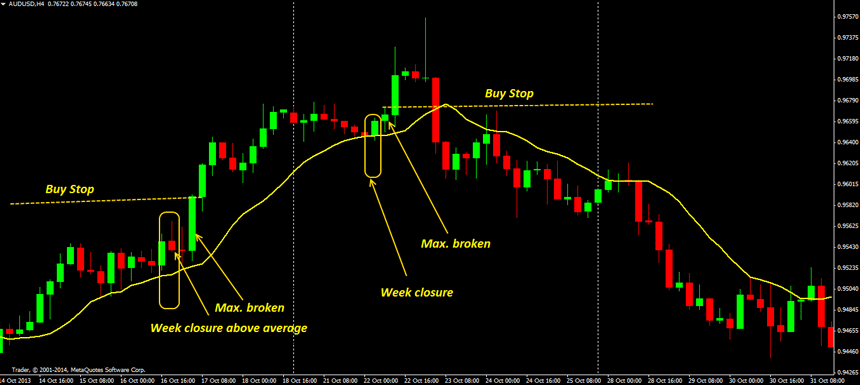
If on the previous week's D1 there was an intersection below EMA(12) (for purchase) or above EMA (for sale), no entry signals should be considered during the current week with the aim of avoiding market entry during flat or trend reversal.
Three oscillators weekly Forex strategy
This forex weekly chart strategy is based on the use of indicators such as relative strength indexes RSI(8), RSI(14), RSI(19), and simple moving average SMA(9).
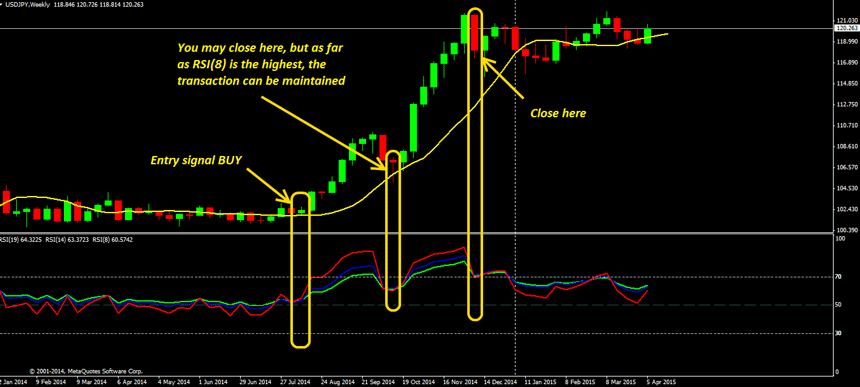
For buy entry, the week has to be closed at a point above SMA(9). The oscillator lines need to keep the following order in the upward direction: RSI(8) (red line) above RSI(14) (blue line), and RSI(19) (green line) at the bottom.
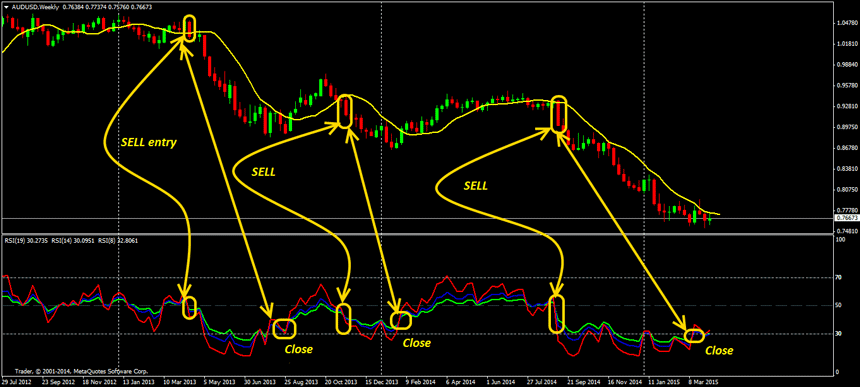
For sell entry, the week is closed below SMA(9). The oscillator lines need to keep the following order in the downward direction: RSI(8) (red line) below RSI(14) (blue line), and RSI(19) (green line) at the top.
The three oscillators strategy may be the best forex weekly trading strategy when the trader is able to effectively monitor the persistent tendencies and not to quit transactions even in cases where peaks are achieved, if the trend continues. However, even in such cases profits can be achieved, although at a lower level.
Lazy trader strategy
This simple weekly forex strategy assumes that orders are opened or closed only twice a week. Under the lazy trader approach, the trader places a buy/sell stop order 20 pips above the maximum, and 20 pips below the minimum. Stop loss is on the level of the opposite order, while take profit actually amounts to triple stop. The break-even point is achieved when profits equal to stop are obtained. It is important within this forex trading weekly strategy not to remove the orders placed, and to close them only at week closure.
Trend method Forex trading weekly strategy
This weekly chart forex strategy is appropriate for those traders who do not have much time for monitoring the market, and thus may only track market trends approximately once a day. Here, the following indicators are used: RSI(8) with a level of 50 as the main oscillator, moving average convergence-divergence MACD(12,26,9) at a level of 0 as the auxiliary indicator, slope direction lines (15,3,0) and (30,3,0) as trend lines; ATM_Pure_MAColor (50) as trend direction, P-Monthly as the monthly pivot for evaluating take profit and stop loss levels, EMA(5) close and EMA(8) open crossovers, and fractals for setting up stop losses.
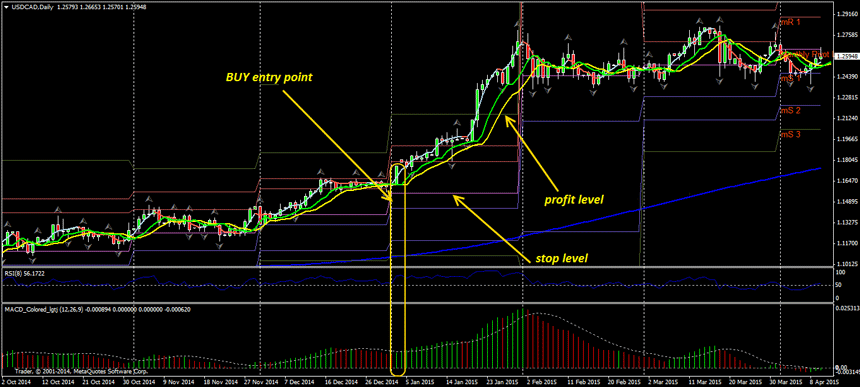
In order to enter the transaction, the following conditions should be met at the closure of W1 candlestick: 2MA lines intersect on W1, RSI is above or below 50, MACD signal bar is above (purchase) or below (sale) the signal line.
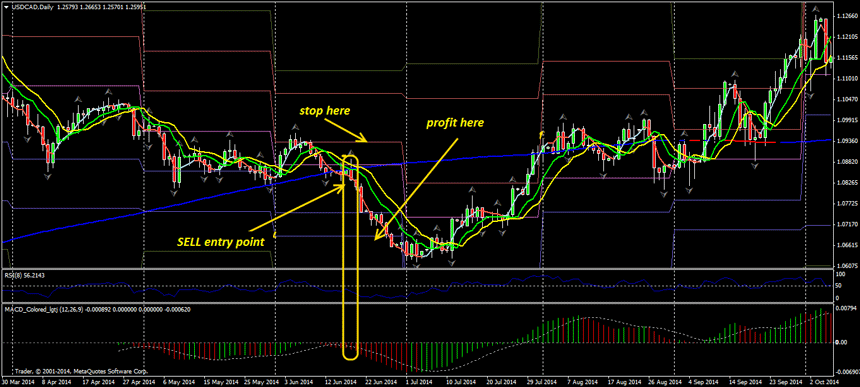
Stop loss can be set for the last fractal, closure of the previous W1 candlestick, above or below the nearest key level, or beyond the trend line. Take profit is the level of monthly reversal, or it is closed as soon as reverse signals emerge.
Conclusion
Weekly forex trading strategies allow benefiting from long-term trading, and they allow monitoring effectively the market trends, as entries are performed at average prices approximate with the main direction. Candlestick analysis is the most precise tool used in any strategy of weekly forex trading, but traders should still work with volatile instruments which being steady trends in typical conditions. Also, forex weekly chart strategies assume the availability of sufficient funds deposited. However, when performed effectively, they provide traders with significant yields, and may be very profitable.


