Find out Tick Chart Trading Strategies in 2025
Tick trading is a short-term trading method that takes advantage of minor price swings in financial markets, notably stocks, currencies, or other assets. Traders use this strategy to benefit from the slightest disparities between bid and ask prices. Tick trading requires the use of quick data feeds and trading platforms, as well as keen analytical abilities to make split-second judgments.
Importance of Tick Charts in Day Trading
Tick charts provide traders with a thorough view of market activity based on transaction volume rather than time intervals. By doing that, tick charts remove superfluous noise and allow traders to identify the underlying direction of the market.
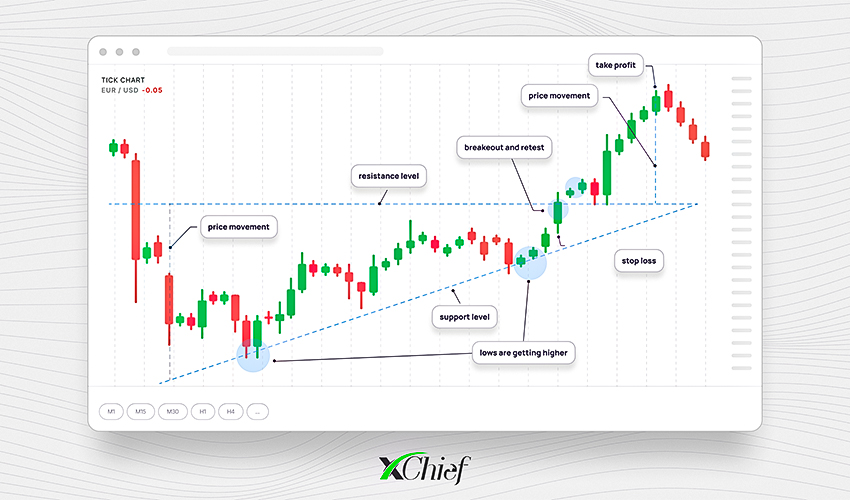
They are quite useful to examine individual deals or a set of trades, providing a detailed snapshot of market activity. During moments of high volume or volatility, tick charts can give more frequent data points, allowing traders to better comprehend market dynamics and change their tactics accordingly.
Tick charts also help to identify when a trend is losing steam by displaying variations in the frequency and intensity of trades. When traders focus on a single tick or a small group of ticks, they usually see when prices break through crucial levels.
Understanding Tick Charts
Understanding tick charts helps you identify trends, patterns, and prospective opportunities more clearly. The degree of knowledge they offer can assist traders in making more precise transactions and improving overall trading success.
Difference between Time-Based and Tick Charts
Time-based charts track market activity over certain periods and display price movements within each interval, providing a consistent perspective of the market across time. Time-based charts are your best choice if you want to comprehend broad market trends and patterns within specific time frames.
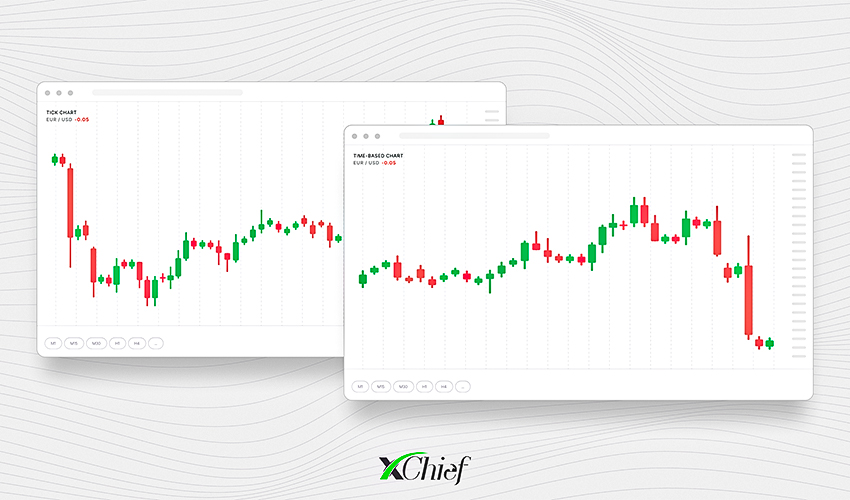
Tick charts, on the other hand, measure market activity in terms of transaction volume rather than time. They show a new bar or point every time a certain number of deals occur, offering a detailed perspective of market trends. Tick charts are better suited to high-frequency trading if you’re looking to catch short-term price changes and exact trade entry and exit locations.
How Tick Charts Show Price Movements
In comparison with time-based charts, tick charts show price movements by adding a new bar or point every time a certain number of transactions occur. This means that the charts display intraday price action based on trade volume rather than time intervals, providing a more dynamic and accurate picture of market activity.
You can adjust the number of transactions that comprise each bar to concentrate on smaller or greater changes according to your trading strategy. Unlike time-based charts, which show bars at regular intervals regardless of market activity, tick charts adjust to the pace of trading, making them excellent for capturing short-term trends and rapid trade opportunities.
Types of Tick Charts
There are three most common tick chart types ‒ let’s take a look at each of them closer.
100-Tick Chart
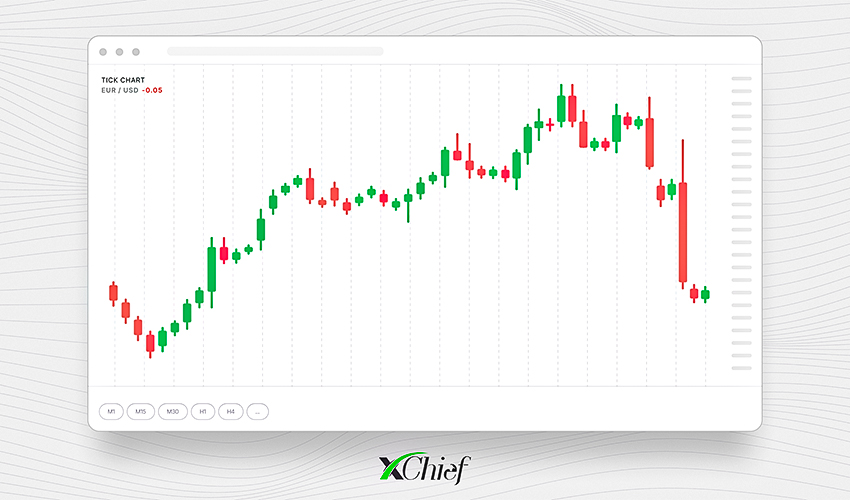
A 100-tick chart adds a new bar every 100 transactions, offering a snapshot of market activity based on the number of deals rather than time. This chart type responds to market volume: during high-volume times, bars form swiftly, while during low-volume periods they form slowly. Unlike time charts, a 100-tick chart captures intraday price activity more precisely, assisting traders in identifying short-term trends and trading opportunities.
Range Chart
Range charts concentrate entirely on price direction, generating a new bar each time a predetermined price movement is met. This implies that range charts filter out time and volume, displaying only price movements existing within the set range. This strategy reduces market noise and assists in identifying distinct trends and possible trading opportunities, making it simpler to spot price patterns and complete precise transactions.
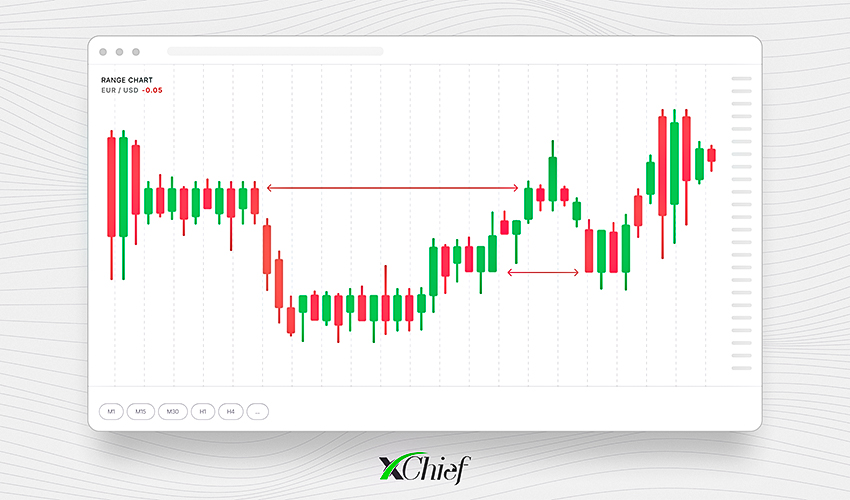
Range charts are also highly effective in analyzing price action and volatility when combined with volume charts as they provide you with a deeper insight into each price movement.
Volume Chart
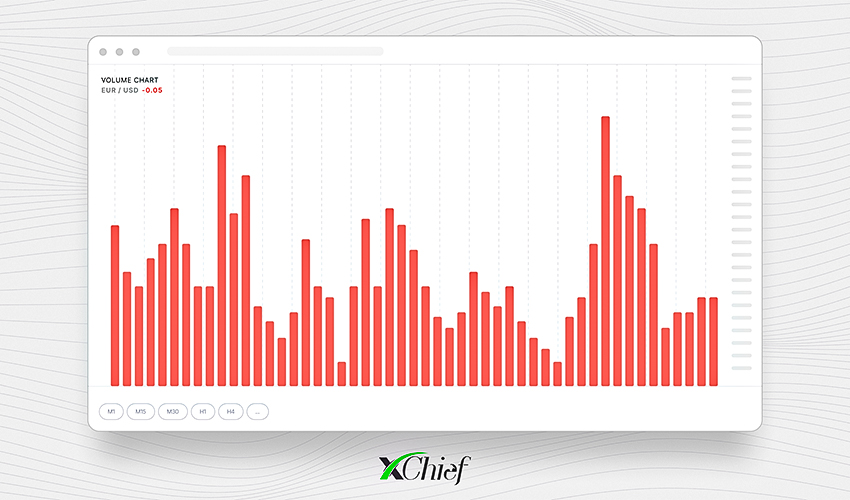
Volume charts show the number of shares exchanged over a certain period, indicating the market's purchasing and selling activity with the use of simple volume histograms. They can show you market strength and supply tick charts' patterns with additional info, whereas tick charts show how prices move within those volume trends. Combining the two can help traders make better trading judgments.
Benefits of Using Tick Charts
Tick charts can give you an impressive scope of market activity. Two main features make them really useful in daily trading.
Accurate Representation of Market Activity
The very concept of tick charts enables day traders to closely track intraday price changes and identify short-term trends. Tick charts assist in making accurate trades and responding fast to market developments by offering a dynamic perspective of the market.
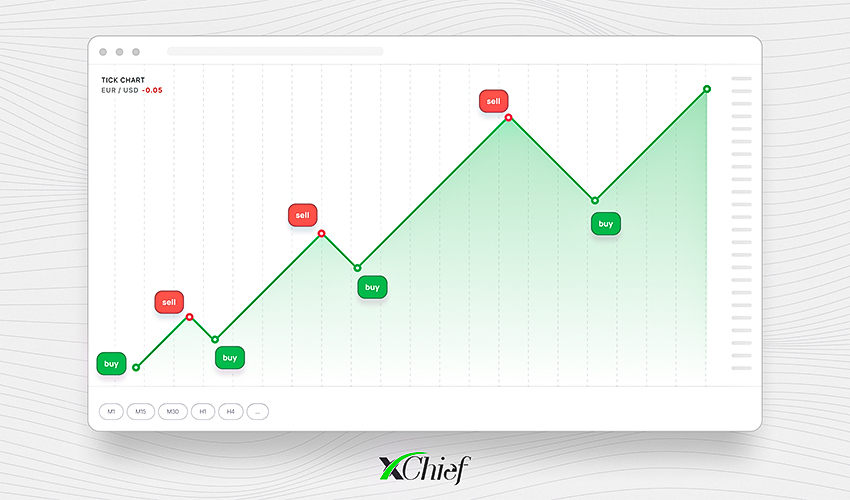
Tick charts assist day traders in identifying successful market opportunities by displaying precise real-time price movements that depend on the number of trades. During periods of strong market activity, tick charts create bars fast, indicating trends and possibilities. On the other hand, bars develop slower during periods of low market activity. This flexibility enables you to adapt your trading techniques to ever-altering market volume and volatility.
Better Visualization of Price Movements
Candlestick charts, by their nature, show price fluctuations in the market. Candlesticks reflect a certain period and display four crucial data points:
- the starting price;
- closing price;
- the highest price;
- the lowest price.
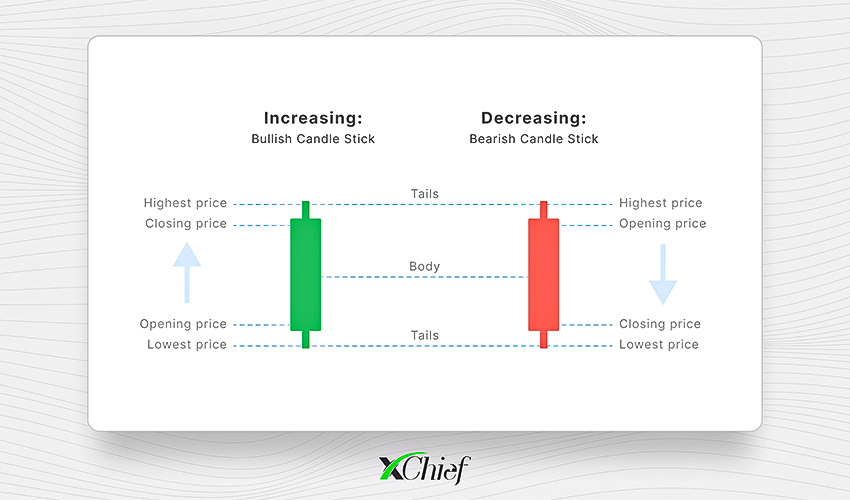
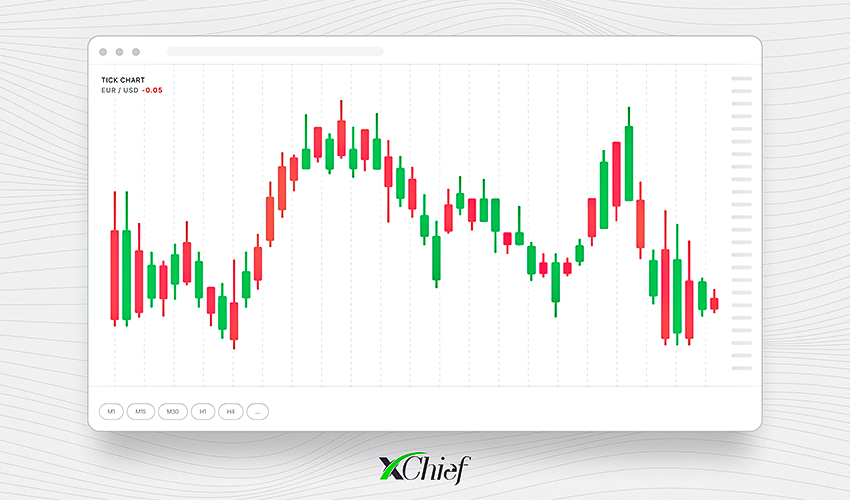
Candlesticks' color and form allow you to complete a fast assessment of market mood as well as visualize probable price direction. For example, a green or white candlestick implies a price rise, whereas a red or black candlestick indicates a price fall. Identifying diverse chart patterns allows you to spot probable reversals, continuations, and trend shifts.
What is the Idea of the Tick Scalping Strategy?
The fundamental idea behind the tick scalping strategy is to create instant transactions that take advantage of minor swings in market prices over an extremely short time. This approach needs tick charts to follow each price change and generate tiny, frequent profits from a variety of deals during the trading day.
This strategy intends to catch one tick in each trade by entering and quitting positions swiftly to capitalize on even the smallest change in transaction prices. It works best in a calm market with tight spreads, allowing you to reduce the risk while increasing possible returns.
Tick Scalping Strategies
So, the tick scalping strategy is pretty effective when used in the right circumstances. There are two common ways to utilize it for the best results.
Identifying Trends with Tick Readings
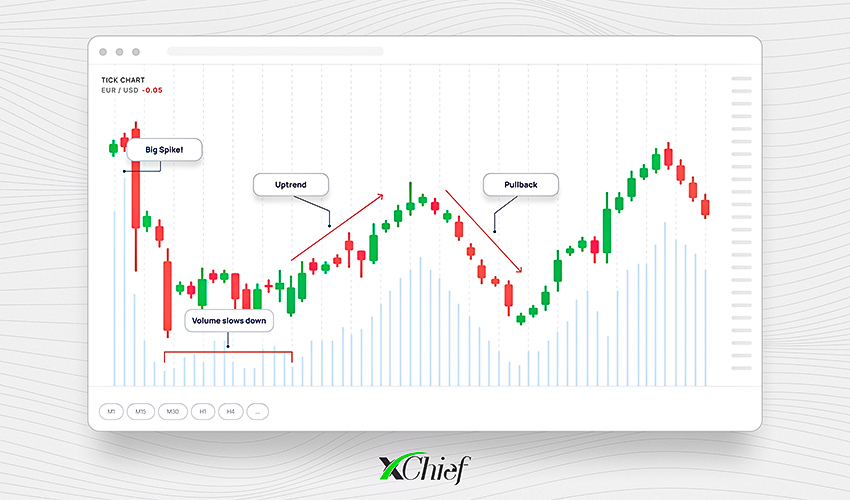
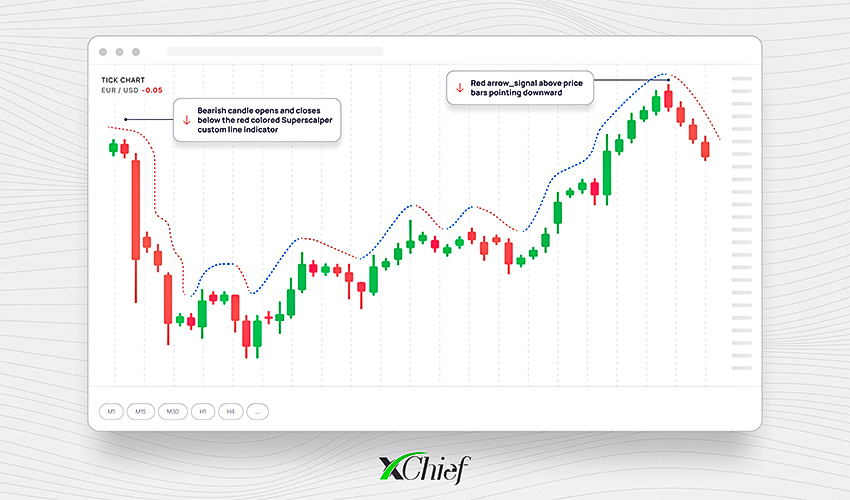
You can use tick readings by analyzing tick charts to identify trends ‒ it’s done by monitoring the frequency and direction of price moves. Frequent and regular transactions in one direction indicate positive or negative market trends. This way, you can assess market strength and possible trend direction or reversal by tracking variations in tick readings.
Utilizing Tick Charts for High-Frequency Trading Strategies
Tick charts measure market activity based on the number of transactions and display price moves in real-time. During intense market activity, tick charts create bars fast, allowing traders to see patterns and possible chances for quick trades. Low market activity causes bars to build more slowly, allowing traders to examine quieter intervals and locate accurate entry and exit positions for their transactions.
Tick charts provide flexibility when it comes to responding to varying degrees of sensitivity and aggression by allowing you to adjust the sensitivity of ticks. A lower tick count improves chart sensitivity and creates more bars, making it ideal for aggressive, high-frequency trading. A higher tick count, on the other hand, decreases sensitivity, which makes it perfect for a bit more cautious approach.
To summarize it all, there are many ways to use tick charts for day trading. You can freely combine different approaches and adjust chart settings to control the flow of your transactions.
But the tick index isn’t necessarily the standalone indicator you should be looking up to since it only reflects the net buying or selling pressure in time. To gain a better view of market circumstances, it’s always a better idea to evaluate the performance of other stocks as well as market indicators. Cross-check tick index signals with trends, volume, and other stock-specific data before executing trades to exclude misleading signals.


